From Doubt to Dollars: The Evidence-backed ROI of EHS Software

Robert Kimball
November 17, 2023

In the course of their work, and with the help of analysts and engineers, EHS professionals could usually make the business case for capital investments that directly mitigated risks or improved operational efficiencies. Unfortunately, when they sought investment in software for managing and measuring their EHS programs they found that business leaders were less receptive (“Isn’t that what we’re paying you for?”). What if EHS leaders seeking such an investment were armed with real-world figures that could help demonstrate the Return on Investment (ROI) of EHS software? Read on.
The Benefits of EHS Software
Of the many responsibilities EHS leaders are tasked with, management of workplace safety programs, incidents investigations, and compliance with EHS-related regulations are the most prominent. The benefits of EHS software to manage these critical functions is well documented and include, but are not limited to, improved visibility and collaboration, streamlined analytics and business intelligence, and simplified internal and external reporting. Below are statistics that demonstrate just how impactful an investment in software for managing these processes can be:- Enhanced productivity: Research by the American Society of Safety Professionals (ASSP) found that companies with robust EHS management systems experienced a 14% increase in productivity
- Improved safety performance: The Occupational Safety and Health Administration (OSHA) reported that businesses with effective safety and health management systems reduce injury and illness costs by 20% to 40%
- Operational cost savings: According to a study by the Aberdeen Group, companies that implemented EHS management systems experienced a 15% reduction in operational costs and a 7% decrease in safety incidents
Results of EHS Software Implementation for Dakota Clients
While these general statistics are impressive, they don’t tell the full story, as Regulatory Compliance itself can lead to significant costs from penalties, fines, and other related legal actions. Assuring EHS compliance requires that organizations understand their regulatory obligations, continually track changes (both to the requirements and to their operational footprint), and ensure that compliance tasks and action items are being completed accurately and on time. But, with an estimated 100,000 action-forcing requirements under the EHS umbrella, managing activities manually across locations is often ineffective, opening the door for serious and costly issues.Based on our interaction with clients over the years, we know cost savings related to usage of EHS software solutions can be substantial, but we didn’t have exact figures to back it up. So, we set out to quantify the savings by combining publicly available data and anonymous customer data to show how our clients reduced their EPA penalties and achieved a Total Recordable Injury Rate (TRIR) lower than that of their industry peers. A summary of the key findings is presented below with the definitions and methodology following.
Definitions and Methodology
Let’s begin with a few definitions to help clarify exactly who and what our analysis included and the periods that were compared:- Dakota Client: An organization who was actively using Dakota’s products for incident management and/or compliance management during the analysis period
- After Implementation: This assumes a 6-month implementation window for all clients. It begins with the reporting year after the Dakota Client initial start date, if prior to July 1st, or two years after the initial start date if July 1st or later
- Total Recordable Incident Rates (TRIR) Calculation Formula (per OSHA): Total Number of Recordable Cases x 200,000/divided by total hours worked by all employees during the year covered
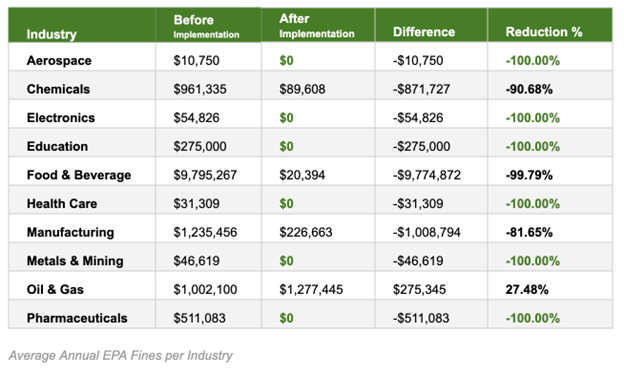
Statistic #1 - Average annual client EPA penalties prior to and after implementing Dakota
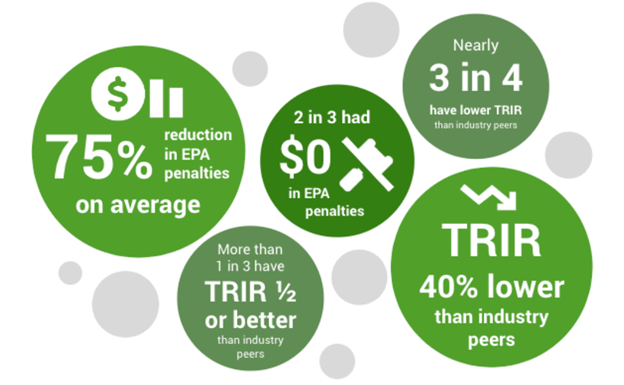
This analysis focused on Active Clients who had EPA penalties prior to using Dakota based on statistics from Violation Tracker. We then compared these clients to the average of penalties over the years since they implemented Dakota. In some cases this was just one year and in others it was as many as 15 years. Statistics were then grouped by SIC Code and averaged by primary industry with the following results.- Dakota clients saw their EPA penalties cut by an average of 75% annually after implementing our compliance management solutions
- 2 out of 3 clients actually saw their EPA penalties reduced by 100%, meaning ZERO DOLLARS, after they got up and running
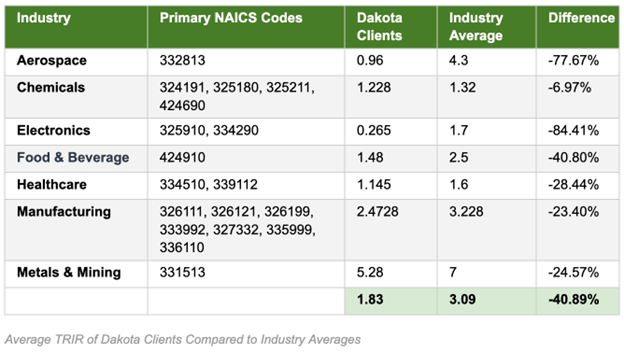
Statistic #2 - Average Total Recordable Injury Rate (TRIR) for Dakota Clients vs. Industry Averages
With a foundation of compliance established and the ability to analyze and learn from safety issues and events in place, it’s logical that improvements to other key EHS metrics, such as TRIR, would follow. While TRIR is a lagging metric that does not present an organization's full safety performance, it is an enduring statistic that can be used to trend an organization's performance Year-over-Year and benchmark against industry peers.For this analysis, Dakota clients who use ProActivity to track OSHA Recordable incidents and Hours Worked data were categorized using their primary NAICS Code. TRIR data was then taken for their latest reporting year, anonymously aggregated by industry, and compared to corresponding industry averages for that reporting year using statistics from the U.S. Bureau of Labor Statistics Occupational Injury and Illness Data. Here is what we found.
- Dakota clients, averaged by industry, have a Total Recordable Incident Rate 40% lower than their industry peers
- Nearly 3 of 4 Dakota clients have a lower TRIR than their industry peers and more than 1 in 3 have a TRIR ½ or better than their industry peers
Again, it’s worth noting that investment in software is often accompanied by organization-wide EHS initiatives. So the statistics listed above are likely the result of both the utilization of EHS software and a renewed commitment to data-driven EHS compliance and safety programs.
Conclusion
EHS management software enables organizations to streamline compliance management and proactively mitigate workplace hazards. Beyond forfeiting the obvious efficiencies gained by centralizing data and institutional EHS knowledge, organizations who don’t leverage software may increase their risk of fines and penalties from OSHA, EPA, and other agencies, and have a greater likelihood of lost time injuries and their related costs.While EPA penalties vary greatly by industry and type, the amount of civil penalties increased 7.7% from 2022 to 2023 with a cost between $58,000 and $175,000 per violation. Additionally, per OSHA’s Injury Cost Estimator, the average direct and indirect cost of a workplace injury is approximately $100,000. For an organization with 1,000 employees and a TRIR of 3.09, that cost would be roughly $3.1M annually. Reducing TRIR to 1.8 would bring that estimated injury cost to $1.8M annually. While those costs are significant, even small reductions in penalties and injury costs can have a huge impact on the bottom line and easily justify an investment in EHS software.
If you’d like to learn more about Dakota’s client successes, many have shared their experiences in these customer stories. If you’d like to talk one-on-one about your own EHS challenges, goals, and initiatives (or learn more about the remarkable statistics presented above), please contact us to schedule a meeting or product demonstration.
Topics:
Software & Data Management
Related
Sponsored Content
About the Author

Robert Kimball
Dakota Software
Robert Kimball is the Director of Marketing at Dakota Software, an industry leader in EHS management and compliance software. In his 11+ years with Dakota, he has worked with clients and product managers to understand and address the challenges facing
EHS leaders. He has led countless presentations, panels, and roundtables on technology's evolving role in EHS and compliance management. Prior to his time with Dakota, Mr. Kimball worked with safety and quality leaders in the pharmaceutical packaging
and printing industry.